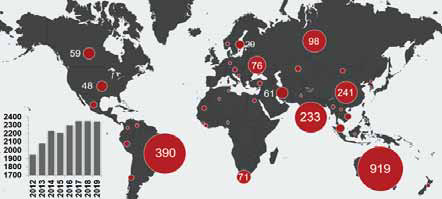
Iron ore production for 2018 (million mt). Source: RMG Consulting 2020
This Years Iron Ore Report Looks
Much Better Than Many Expected
High prices and a tight market could extend the rally well into 2022
By Anton Löf and Olof Löf
There were, however, significant differences across regions. Chinese crude steel production increased by 76 million mt in 2019, an increase of 8.3%, compared to an increase by 5.6% in 2018. At 996 million mt, China continues to be, by far, the largest producer, accounting for 53% of total crude steel produced. India, the second-largest producer with an output of 111 million mt of crude steel in 2019, only accounts for 6% of global steel production. There are six countries with national production of more than 70 million mt of crude steel in 2019. These countries together accounted for 77% of global production.
According to the OECD, global steelmaking capacity increased slightly in 2019, the first time since 2014 that net capacity has increased. The current global steelmaking capacity at the end of 2019 is 2.363 billion mt. This represents an increase of around 1.5% from the end of 2018. Most of the capacity additions were located in Asia, where an additional 30 million mt of capacity came on stream. Also, companies in the Middle East (2.8 million mt), Africa (2.4 million mt), the CIS (1.5 million mt) and Europe (700,000 mt) added new capacity.
The gap between capacity and production did, however, continue to narrow over 2019. Production increased more than capacity. Using the OECD figures for capacity and the end of the year, WSA production figures, gives the global capacity utilization of 79% in 2019, up from 78% in 2018. This is, in fact, the highest utilization rate during the last 20 years, and at its low, in 2009, it was only 61%. There are, however, several projects that will potentially add to the steelmaking capacity over the years 2020-2022. According to the OECD (Latest Developments in Steelmaking Capacity 2020), some 58 million mt of steelmaking capacity is under construction. While an additional 20 million mt is in the planning stage for a possible startup sometime prior to 2022.
China added some 24 million mt in capacity during 2019, but since 2015, capacity has fallen by 63 million mt. The Chinese government reported that closure of capacity, especially older and less efficient plants, are going according to plan. Targets for reduced capacity and increased closures are also being revised upward, with the Hebei province leading the way.
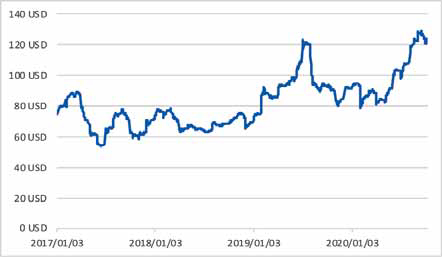
The global steel demand recovery from early 2016 supported rising prices. A peak was reached in early 2018 from which prices have retracted. At the end of 2019, flat steel prices, according to the OECD, was 13% lower than at the start of the year and rebar prices were down 9%. Prices for the key steelmaking raw materials (iron ore, coking coal and scrap) have followed divergent trajectories in 2019. While iron ore prices increased by 32% during the year, coking coal prices decreased by 15% and steel scrap prices fell by 17%.
Iron Ore Production
Global output of iron ore decreased by a
modest 0.3% to 2.346 billion mt in 2019.
The decrease is almost exclusively related
to the fall in production in Brazil related to
both the late dam disasters and COVID-19
restrictions. Brazil saw its production decrease
by 58 million mt in 2019 compared
to the year before, down 13%. Most other
larger producing countries saw increases in
production, however modest.
Australia remains the leader, producing 40% of all iron ore worldwide. Brazil accounts for 17% of global production. During 2019, Australia added some 11 million mt to its output, an increase of 1.2% to 919 million mt. In Asia, most producing countries experienced growing production. India, for example, increased iron ore production by 14% and reached 233 million mt. Also, Iran increased production, up 11% to 61 million mt as well as China. Chinese iron ore production grew 3.3 million mt to 241.3 million mt in 2019. In Europe, including the CIS, production increased by 2.4% in 2019, up to 231 million mt. African production was stable at 92 million mt. Output by the two major African producing countries, South Africa and Mauritania, both declined, the former by 5.1% and the latter by 2%.
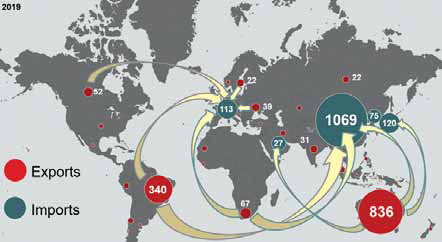
Iron Ore Trade
Global iron ore exports decreased by 1.7%
in 2019. This is the second year in a row
that exports are decreasing. World total
iron ore exports have increased roughly
43% during the last 10 years and amounted
to 1.531 billion mt in 2019 compared
to 1.558 billion mt in 2018. Australia is
by far the largest exporter of iron ore with
a market share of 55%, an increase of
one percentage point from last year. Exports
from Australia continued to increase
during 2019, reaching 836 million mt, up
0.2%. The second largest exporter, Brazil
has a market share of 22%, a decrease
of three percentage points compared to
last year. Brazilian exports fell by 13% in
2019 and reached 340 million mt, as discussed
earlier, on account of closures related
to the dam disasters and COVID-19.
South Africa exported 67 million mt of iron ore in 2019, which makes it the third largest exporter, Canada with 52 million mt is fourth and Ukraine at 39 million mt is fifth. Together, the five most important iron ore exporting countries accounted for 87% of total exports in 2019, down from 88% in 2018. Among the larger producing countries, Indias exports increased the most, by 69% in 2019 reaching 31 million mt. At the same time, imports came down by 87%. India, which seemed to be on its way to become a net importer of iron ore, has turned around and produced iron ore is now enough to satisfy both an increase in exports and an increase in steel production.
China alone accounts for 69% of total imports. During 2019, the countrys imports of iron ore increased 0.4%. While minor, this is an increase compared to last years decrease. During 2019, China also increased its iron ore production, but import dependency is still some 82%, the same as last years figure. All other regions experienced decreases in imports during 2019. Seaborne iron ore trade in 2019 decreased by 1.6% to 1.471 billion mt. The main reason being the drop in exports of almost 50 million mt by Brazil and Vale.
Iron Ore Pellets
Global production of pellets in 2019 increased
to 501 million mt, up 3% compared
to 2018. Exports of pellets fell in
2019 and reached 134 million mt, down
5.1%. The largest iron ore pellet exporters
are in order: Brazil, Sweden, Canada,
the Ukraine and Russia.
The share of pellets in total iron ore production has declined since the late 1990s when it ranged between 26%-27%. During the last couple of years, the share of production has been relatively stable at around 20%, and in 2019, it reached 21%. However, the Mariana dam failure and the subsequent closure of the Samarco production units have underlined the sensitivity of pellet demand to world market conditions and prices. In 2015, total production of pellets coming from Brazil was 63 million mt. In 2019, production was more or less cut in half and only reached 32 million mt. According to plan, Vale will restart production at the end of 2020, so there is potential for an increase in world production of pellets in the short term.
The iron ore market has continued to be tight into 2020. According to the Department of Industry, Science, Energy and Resources in Australia, iron ore inventories are at near five-year lows. Supply disruptions in late 2019, such as cyclones in the Pilbara region of Western Australia and flooding in the south and east of Brazil, pushed prices higher. With the introduction of COVID-19 containment measures, further capacity has been curtailed at individual mine sites. The robust and consistent demand from China and disruptions of the supply of iron ore, mainly from Brazil, have forced iron ore prices to adjust to a tight seaborne market and stay high even though the general economic climate remains uncertain. The iron ore prices, 62% Fe CFR China in mid-October 2020, was around $122/mt, up 34% since the start of the year. The average price until mid-October 2020 is $101/mt, an increase in average price of 8.5% compared to the average price of 2019.
The price premium for high-quality iron ore increased sharply during late 2018 as Chinese demand increased and high-quality ore supply from Brazil tightened. Subsequently, markets adjusted to use greater quantities of lower grade ore, with the price premium easing during 2019. The price spread between iron ore grades increased again around April 2020 amid a surge in demand for higher-grade ore, but has since abated somewhat.
Project Pipeline
In 2019, global production of iron ore
fell by 6 million mt. However, most of
the important iron ore producing countries
increased their production, with the
exclusion of Vale and the drop in Brazilian
production of 58 million mt. These
increases were not the result of new green
field capacity coming on stream, but rather
incremental growth in existing operations.
Iron ore capacity has been relatively
stable during the last three years with
most of the capacity additions located in
the two largest iron ore producing/exporting
countries: Australia and Brazil. However,
with the high prices seen recently,
the industry will likely see an increase
in exploration expenditure earmarked for
iron ore. Further, some African projects
have attracted renewed interest and some
mines that were closed down have considered
reopening.
In Brazil, during December 2019, Vale completed the physical works and startup of the CLN S11D project, the infrastructure project to support the S11D mine and the Northern System. Until 2022, the project will be in a ramp-up phase. This means the S11D mine that was completed in late 2016 now has reached full production capacity. The company also plans to increase production another 10 million mt/y within the Northern System. As of the end of the first half of 2020, the project is 25% completed and is expected to be finalized by the second half of 2022. Vale targets capacity of 400 million mt/y by increasing production across operations through debottlenecking and the restart of temporary closed operations. Further into the future, Vale envisions a capacity of 450 million mt/y. Also in Brazil, Anglo Americans Minas-Rio mine in late December 2019 received necessary permits to finalize the stage 3 expansion that will take the mine to full capacity. The mine is expected to deliver 26.5 million mt/y. The Germano mine, operated by Samarco, closed since the Mariana dam disaster in November 2015, is set to come on stream again in December 2020. The plan is to start operations at 8 million mt/y and increase production to 24 million mt/y during a ramp-up period that could extend over 10 years.
In Australia, iron ore projects account for more than AUD 40 billion ($28.6 billion) of potential investment expenditure. There are currently some four committed projects as well as 12 projects labeled as in the feasibility stage and another 13 that have been publicly announced. However, there has been little progress in iron ore development projects over the past years. One of the few projects completed during 2019 was the refurbishment of the Koolan Island iron ore mine, owned by Mount Gibson, with a capacity of 4 million mt/y. There are a couple of largescale projects under way. The Iron Bridge Magnetite Project, co-owned by Fortescue Metals Group (FMG), Formosa Steel and Baosteel, is progressing. The project is estimated to cost $2.6 billion and have a capacity of 22 million mt/y of high-grade iron ore. The estimated start of operations is 2022. Another FMG project, Eliwana is set to commence production in December 2020 and have a capacity of 30 million mt/y. Rio Tintos Koodaideri project is planned to start production in late 2021 and have a capacity of 43 million mt/y. Further, the company is investing in West Angelas and the Robe Valley, with first ore expected in 2021. Investments are under way in the Greater Tom Price operations. All of Rio Tintos investments are related to sustain current production capacities. Finally, BHPs South Flank mine is planned to replace existing production from the Yandi mine, with production starting in 2021 at a capacity of 80 million mt/y.
In Ukraine, Ferrexpo is adding 6 million mt/y of additional processing capacity, which will raise the raw ore capacity to 36 million mt/y and will further realize full capacity of pelletizers (12 million mt/y) in 2021. For the longer term, the company is presently studying potential for the increase of raw ore production capacity of 50% and to increase pellet plant capacity incrementally by 3 million mt/y.
In Africa, projects are slowly being revitalized. In Guinea, Simandou, one of the worlds largest undeveloped projects, is slowly moving forward after several disputes and Rio Tinto failing to sell its remaining shares in block 3 and 4 to Chinalco. Rio Tinto stated that the company continues to work with joint-venture partners, Chinalco and the government of Guinea, to explore ways to optimize, develop and fund the world-class Simandou iron ore deposit and the trans-Guinean infrastructure needed to support the mine. However, no timelines were discussed. Simandou will happen, with or without Rio Tintos involvement Rio Tintos CEO J-S Jacques said. During late 2019, Simandou blocks 1 and 2 was auctioned. The winning bid came from the SMB-Winning consortium, formed by the Singaporean shipowner Winning Shipping, the Chinese aluminum producer Shandong Weiqiao, the Yantai Port group, as well as the Guinean transport and logistics company United Mining Supply. The winning bid was for $15 billion. Other bidders included FMG in an attempt to go outside Australia. Also close by, on the border to Liberia, are the Zogota and Nimba projects. On September 5, 2019, High Power Exploration, led by Robert Friedland, founder of Ivanhoe Mines Ltd., acquired the world-class Nimba iron ore deposit in the Republic of Guinea. The company is planning to bring a starter mine with the capacity of 1-5 million mt/y into production as quickly as possible while completing feasibility studies for an operation of at least 20 million mt/y. All the projects in Guinea are located in the mountainous region in the north of the country and demand the construction of a new railway, a quite complicated infrastructural project.
In the Republic of the Congo, the Zanaga project, a joint venture between Zanaga Iron Ore and Glencore, is continuing. The projected mine will produce 12 million mt/y in the first stage and raising output to 30 million mt/y in a second stage. An early production project with a capacity of 1 million mt/y is also under consideration, however, no timelines were presented. Also, in the Republic of the Congo, the Sapro group exported its first tonnages in Q1 2019 a shipment of 23,000 mt of iron ore. The company, which plans to produce 12 million mt/y for export, mainly to China, seems to have failed to ship any more material. The total export of the Republic of the Congo did not amount to more than 19,000 mt, according to Chinese import statistics.
The Scully mine in Canada, previously owned and closed down by Cleveland Cliffs in 2014, was restarted by its new owner Tacora Resources Inc. The company announced its first delivery in August 2019 and seems to be on its way to achieve nameplate capacity of 6-6.5 million mt/y. The Sydvaranger mine in northern Norway, another example of a closed down mine getting new attention, received authorization from authorities in mid-2019 for the resumption of operations. The mine targeted iron ore concentrate shipments in 2020, however, startup of production has been delayed until sometime in 2021. There are also examples of idling of capacity due to high operating costs, for example, U.S. Steels Keetac operations.
While there are quite a few projects in the pipeline, the main additions to production in the near term will probably come from Brazil and Vale as well as Australia with FMG, BHP and Rio, all adding capacities. Most of the other projects are either small or further out in time. All in all, the market seems likely to enter another period of overcapacity. This could push or stall some of the early-phase projects in the pipeline. Still, the project pipeline as it looks like in mid-2020, could indeed be the foundation for an oversupplied market during the next couple of years.
Corporate Concentration
Corporate concentration in the iron ore industry
has remained fairly constant over
the last couple of years. In 2019, the
10 largest companies controlled 58% of
global production, a decrease from 2018
(60%), but in line with the 2017 (58%)
and the 2016 (58%) numbers. The decrease
is mostly related to the fall in production
for Vale. The company decreased
its production by 83 million mt in 2019,
compared to 2018, down 21%. However,
Rio Tinto and BHP Billiton, the second
and third most important iron ore producing
companies, reduced their production
by 3.4% and 0.7%, respectively. This was
partly compensated by large increases
from FMG and Anglo American.
The 2005-2008 trend of decreasing concentration, due to swift production increases by many small- and medium- sized producers was reversed in 2009 when the major producers got their large expansion programs up and running. Since then, industry concentration has increased slowly but steadily, apart from 2019. While the Big 3 iron ore mining companies (Vale, Rio Tinto and BHP) earlier have increased their control over total world iron ore production, it now seems like they have lost out somewhat to the other large producers. In 2018, the Big 3 combined control reached 40%. In 2019, this had decreased to 37%.
Vale, the Brazilian-based major mining company, despite a drastic fall in output during 2019, remains the worlds largest iron ore producer, with 302 million mt of iron ore produced in 2019, down from 385 million mt in 2018. All of Vales mines are in Brazil and its market share decreased from 16% in 2018 to 13% in 2019. Vales market share peaked already in 2007 at 19%. Rio Tinto has been the second-largest producer since 2016, when it overtook BHP and regained its traditional second rank. Rio Tinto produced 281 million mt in 2019, down from 291 million mt the year before. Rio Tinto has a market share of 12%, a slight decrease compared to 2018. Most of Rio Tintos mines are located in the Pilbara region in Australia. In addition, the company controls the Iron Ore Co. of Canada with mines in Labrador. The market share of BHP stayed at 12% and production reached 272 million mt in 2019. Except for the Samarco joint venture in Brazil together with Vale (50/50), which has not been producing since 2015, all of BHPs mines are in Western Australia.
China increased its domestic production during 2019 of raw iron ore. In 2020 though, production has been stable and increased a modest 2.6% from January to August, compared to the same period last year. As the price has remained at a high level during the first half of 2020, additional marginal independent producers might be able to enter the market and push corporate concentration down. However, Vale is on track to restart closeddown operations. Should the company be able to reach its old production figures of 2018, a reversal of the decline in 2019 could happen. Considering that Vale is planning for a 400-million-mt/y capacity, a future scenario with a higher corporate concentration is highly likely. Most probably though, for 2020, corporate concentration will only change marginally. How much will mostly depend on Vales ability to restore production. The company has communicated a production guidance of between 310-330 million mt for 2020 with a higher probability of production ending up in the lower end of this interval. This would mean a relatively stable production compared to 2019 and, consequently, relatively stable corporate concentration for 2020 compared to 2019.
Market Outlook
Global economic growth in 2019 reached
2.8% according to the IMF October World
Economic Outlook. The IMF forecasts
a decline of 4.4% in 2020 followed by
a 5.2% growth in 2021. While this is a
more negative forecast compared to the
April outlook, it is actually 0.8 percentages
better than anticipated in June 2020.
The latest revision reflects better-than-anticipated
second-quarter developments
and indications of a stronger than expected
recovery in the third quarter. If the projections
come true, the global economy in
2021 will have seen a modest growth of
0.6% over 2019. The uncertainties, IMF
pointed out, are unusually large in this
stage because of the pandemic. With a potential
second wave of COVID-19 and related
forced closedowns and impairments
to the global economy, much could happen
between now and the end of the year.
During 2019, world crude steel production increased by 3%. For the first eight months of 2020, global steel production declined 4.2% compared to the same period last year. China alone accounted for roughly 58% of the crude steel production globally during the first months of 2020. The countrys production of crude steel grew by 3.7% during the period. However, Chinese production will most likely taper off during the winter months with governmental restrictions on emissions. Total growth over the year is hence likely to be lower than so far this year. The WSAs Short Range Outlook June 2020 for world steel use anticipates a decrease in world steel demand by 6.4% in 2020, followed by an increase of 3.8% in 2021. China, on which so much depends, is forecast to increase its steel demand by 1% in 2020 and no growth in 2021.
Something that should negatively impact the growth potential for steel demand is Chinas move toward a lower GDP growth with a society where consumption rather than investments is the driving force of economic activities. Further, globally, the scrap share of the steel burden is increasing as more and more steel becomes available for recycling. Analyzing the numbers from China, this trend is increasing rapidly. No doubt this will limit the demand growth for virgin units of iron ore into the future. For the period January to August 2020, the combined global pig iron and DRI production decreased compared with the same period last year, by 3.1%. Further, for the first six months of 2020, 12 major companies, which reported quarterly figures produced 624 million mt. This represents a decline of 2% compared to the same period last year. Vale shows the largest decline in absolute numbers with 10 million mt, down 7.4%. CSN, another Brazilian miner, cut production by 30% in the first half of 2020 compared to 2019. As a result, Brazilian exports for the period January-August 2020 decreased by 8.6% compared to the same period in 2019. Chinese imports during the period January- August 2020 increased by 11%, compared to the same period of 2019. Chinese imports were 760 million mt for the first 8 months of 2020, equal to 1.140 billion mt on an annualized rate. Chinese production of raw iron ore for the first 8 months of 2020 increased compared to the same period last year with 2.6%. As a result, the market has continued to be tight during 2020, and prices have stayed high.
There is little indication of increased supply for the end of 2020 and the main risk to the iron ore price is thus falling demand, mainly from China. Considering the latest development in the seaborne market, it is likely that a slight fall in demand will take place and consequently, prices will fall back. However, considering the current situation, iron ore prices, 62% Fe CFR China, below $100/mt during 2020 seems unlikely. With a modest growth in steel for 2021 compared to 2019 and an increased scrap ratio, demand for iron ore will be subdued. Combined with the fact that iron ore production capacity will most likely increase faster than iron ore demand, as discussed, the spot iron ore 62% Fe price will be under pressure. An iron ore price somewhere around $80/mt is more realistic considering the bleak circumstances for 2021. However, the iron ore market is balanced. Should steel demand and steel production surprise to the upside and some of the planned new mine capacity fail to materialize the surplus could turn into a deficit fairly quickly and the price trajectory of 2020 could be repeated yet again in 2021.
Anton Löf and Olof Löf are with RMG Consulting, an independent consultancy firm based in Stockholm, Sweden. www.rmgconsulting. org. For further details, contact Anton Löf at anton.lof@rmgconsulting.org.