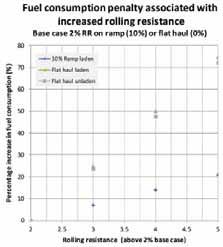
Figure 1As rolling resistance increases, so does
fuel cost.
Using Big Data to Predict
Haul Road Performance
Knowing which parts of the haulage network require attention,
miners can dispatch maintenance resources more effectivelys
By Dr Roger J. Thompson
Haulage represents one of the largest cost elements, especially for deep, large open-pit operations. Today, more than 50% of mining costs are associated with loading and hauling material out of such pits. That translates into a significant opportunity to realize cost savings through improved haul road performance.
The primary measure of mine road performance is often based on rolling resistance, which, when combined with the road grade, is the resistance a haul truck must overcome to move forward. While road grade is fixed by mine geometry, rolling resistance is variable from road to road and also with time and traffic volumes, too. All roads deteriorate over time and under the action of traffic, and its this deterioration that is expressed in the form of rolling resistance.
Rolling resistance appears in many forms. With soft underfoot conditions, the truck tire creates a depression, out of which it has to climb. In this case, rolling resistance occurs as a result of the deformation of the roads construction materials. A natural amount of rolling resistance also occurs on great running surfaces. Rain can affect haul road performance as well as surface defects. Quantifying rolling resistance is difficult and its best just to relate its impact on productivity and costs.
Its important to first identify haul road problems, determine the severity and predict the impact on operations. Do these issues need to be resolved now, in the next month or the next half-year?
Understanding the Impact of Rolling Resistance
Rolling resistance appears in many forms.
With soft underfoot conditions, the truck
tire creates a depression, out of which it
has to constantly climb as it moves. In this
case, rolling resistance occurs as a result of
the deformation of the roads construction
materials or layered works. All mine roads
will have a minimum amount of rolling
resistance even on the best designed,
built and maintained roads typically 2%-
2.5%, but in this case, resistance is primarily
from surface defects as opposed to the
layered works as a whole. With poorly designed
roads, both sources combine to generate
high rolling resistance a problem
that gets worse with rain or excessive watering,
which softens construction materials
further, leading to even higher resistance.
Accurately measuring, evaluating and modeling
rolling resistance can be complicated,
but the value of the information is high
since its rolling resistance that ultimately
dictates how a mines unit cost of haulage
changes in response to road deterioration.
Rolling resistance itself is always working against us except in the context of a downgrade haul and, in that case, it assists only from a truck retarding perspective. The road defects that contribute to rolling resistance even on a downgrade haul indicate underlying road design, construction or road maintenance issues that would nevertheless adversely affect tire and truck life, as well as truck maintenance and repair costs, too. When hauling against the grade, the cost of fuel is also added to the equation as a source of unwarranted additional costs.
Fuel consumption increases with rolling resistance. Looking at a fuel consumption model across a range of rolling resistance increases from 2% to 5%, the fuel cost-penalty associated with this increase differs appreciably between flat hauls and ramp hauls. The blue line in Figure 1 represents the ramp haulage on a 10% grade (or 12% to 15% total [grade + rolling] resistance). The other two lines are the flat hauls (0% grade) laden and unladen. The greatest impact of rolling resistance is on the flat haul in terms of fuel consumption.
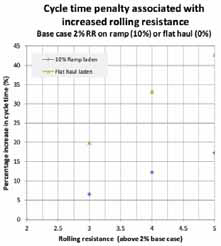
Rolling resistance has a similar effect on cycle times. The blue line in Figure 2 represents a ramp haul (10%) laden. For a 1% change in rolling resistance (2% to 3%), a 7% increase in this segments cycle times is seen. On a flat haul segment, cycle times will increase 20% for the same 1% increase in rolling resistance.
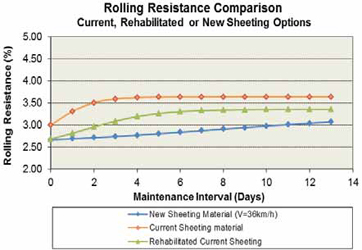
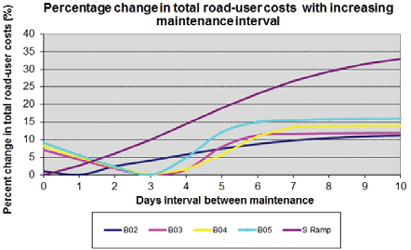
Ongoing (current) haul road maintenance, rehabilitation or even rebuilding is a necessary expense. When the rolling resistance increase is modeled for three wearing courses (current, rehabilitated and rebuilt) and plotted against maintenance intervals (days), its easy to see where the investment yields the biggest bang for the buck. On the current haul road (the orange curve in Figure 3), rolling resistance grows from 3% to more than 3.5% over a relatively short four-day interval. Mine engineers would be interested in assessing the cost-penalty per ton hauled in the difference between 3% and 3.5%.
On the other hand, if the mine decided to rehabilitate its wearing course material by in this case increasing the amount of larger sized hard-aggregate, mixing and re-compacting (the green line), the rolling resistance is reset to 2.5% and it steadily creeps up to 3.2 %, but in this case over a longer 12-day period.
If the mine rebuilds the road (replaces the wearing course entirely, blue line) with a better specified material, rolling resistance also resets to 2.5% the day its bladed. Then, as with the other options, the effects of traffic-induced damage cause the rolling resistance to steadily climb, but in this case to a little more than 3%, but only after two weeks of trafficking.
Big Data Can Assist
Several mine sites are now marrying existing
near real-time information from haul
truck fleets to other sources of site and
road-specific information to measure and
manage truck and driver performance. A
similar approach is used in the case of
rolling resistance, with the data generated
from the trucks supplemented with
information from, for example, the Proof
Engineering Road Condition Monitor, to
help quantify what the truck is telling us.
Gathering data from these various sources
allows researchers and ultimately operations,
to identify trends in performance
across the full network of active roads.
Most mines have daily operating reports. These reports tell what happened within a defined timeframe, but they do not explain why it happened or whats likely to happen in the future. Add some data and analytics to the mix and the mine engineers can get more reactive reporting, more insight moving toward predictive reporting and then move toward a plan of optimization. That will help the team understand what is likely to happen with their network of roads and plan accordingly to minimize the cost-impact of deterioration and rolling resistance in the future.
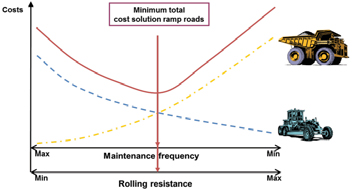
The relationship between rolling resistance, the frequency of road maintenance and their impact on total (truck haulage plus road maintenance) costs has been established. Mines performing regular haul road maintenance on well-designed and well-built roads maintain a relatively low average rolling resistance. As road maintenance is reduced, the average rolling resistance increases to a higher overall value. Somewhere between the two curves, representing the cost of road maintenance and the cost of truck haulage, there is a sweet spot, where a mine would provide a certain frequency of road maintenance to minimize total haulage costs. Figure 4 shows the sweet spot for a ramp haul road.
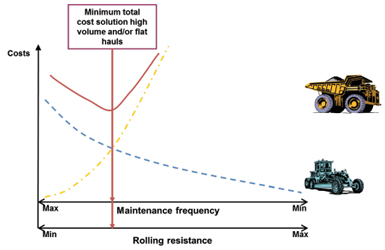
Ultimately from a management perspective, the mines engineers need to know which types of roads on their haulage network are likely to fall into what categories, and what their cost-sensitivity is. Then they can predict and schedule maintenance requirements to minimize the total haulage costs.
Engineers can assess the impact of rolling resistance on speed and fuel burn quite readily, but without real-time rolling resistance, these relationships are just a best-guess approach. Data analytics can be used to identify and combine data to measure real-time rolling resistance.
Adding Drive Efficiency to
the Equation
The first part of the data analytics and
modeling approach is to understand the
truck-engine-drive system efficiencies
and reduction ratios to determine what
the mine should be getting from this
truck. The second part is: What does the
real engine power look like? Benchtop
power will differ from the SAE-rated power
of that engine.
Using a truck manufacturers SAE engine power and speed curves for a particular mechanical drive truck, from gear D1 to D6, drive-reduction ratios and the associated engine efficiency can be found. This is then used to back calculate from the engine rpm operating point the available torque, rimpull (based on wheel diameter) and corresponding truck speed. The Australian researchers found that drive reduction ratios vary, typically from approximately 94 in D1 to 22 in D6 and efficiencies were typically between 82% to 86%, dependent on specific truck model.
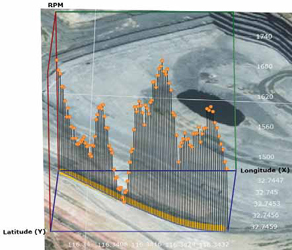
By marrying the haul truck speed rimpull gradeability model with the real-time performance data coming off that truck, this can be overlain with high-accuracy survey profile data from the as-built road to determine the variation in grade of the road every few meters. In the case of a ramp built at a design grade of 10%, slight local variations are often seen in the ramp grade. Data analytics is then used to estimate at real grade at each point along the road. Using this approach, we can flick through these data at any point along the haul where speed is relatively constant and pick up an operating point, and by marrying truck operating point gradeability with measured grade, speed attained and load, its possible to isolate the road rolling resistance at that specific point.
Next, the mines engineers need to consider the effect of multiple haul trucks. Looking at multiple trucks and applying the same analytical process to the data for each of the trucks reveals consistent rolling resistance reporting in terms of the average value over a selected distance of road.
The different colored points along this haul road (See Figure 6) represent the rolling resistance on that road as measured by the operating point of the truck married with the speed-rimpull-gradeability and the road survey data. There are some obvious points of concern for this ramp, where the trucks encounter a higher than desirable average rolling resistance.
Application Scenarios
By understanding how rolling resistance
changes in real-time, engineers can predict
how various segments of the road
network will change over time, and thus
in terms of traffic volumes applied to the
road. Armed with this knowledge, a mine
site can then identify segments of the
network that, as traffic volume changes in
response to production scheduling, offer
the best potential to deliver a reduction
in haulage costs.
The key to the whole exercise is evaluating, from measured data, how an individual roads rolling resistance increases. The concepts of big data can be leveraged to achieve this quite readily from existing data sources. In the case of autonomous haulage especially, this approach has the potential to inform operations of road conditions in real-time and allow for road maintenance to be planned, scheduled and integrated with production requirements.
Dr. Roger Thompson is a professor of mining engineering at the Western Australian School of Mines. This article was adapted from a presentation he gave at the 2017 Haulage & Loading conference. He can be reached at r.thompson@curtin.edu.au.