Inventory Management Study Shows How
Mining Stacks Up Against Other Sectors
New cross-industry survey illuminates the landscape and challenges of inventory
management and optimization
The study asserted that historically, asset-intensive companies such as mining have a somewhat sub-optimal record when it comes to managing inventory, specifically excess, obsolete, incorrect material, and/or wrong quantities in stock. That said, there is no doubt that when a piece of equipment goes down in one of these industries, everyone mobilizes to get the oxcart out of the ditch and ensure the asset is back online as quickly as possible, according to study by contributing author Andy Flores, a partner at ScottMadden.
However, the systemic issues related to not having the right mix of inventory on hand can often go unaddressed as the pressures on asset management personnel compel them to have material on hand just in case. The real challenge then is determining what the right amount of inventory is for infrequently used items in an asset-intensive environment where downtime subtracts from net income.
The survey was designed to address
three elements:
Provide up-to-date information about
the application of inventory optimization
practices across asset-intensive
industries;
Compare practices across several industries
that maintain MRO inventory environments;
and
Review metrics for inventory and asset
reliability to understand the relationship
between a selection of inventory management
practices and performance.
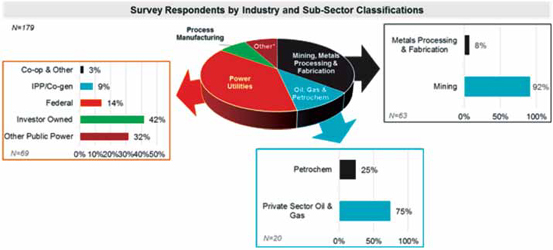
The survey questionnaire consisted of 11 questions focused on inventory optimization practices and three questions related to inventory and asset performance. It involved more than 170 respondents in mining, power utilities, metals, processing and fabrication, oil, gas, and petrochemicals, and other industries.
Inventory optimization, according to
the author, is a cross-functional exercise
that requires the right practices
(process, technology, etc.) to execute
effectively and deliver high-performance
results. Key takeaways from the study
results involve:
Accountability for inventory optimization
The survey results indicate that companies,
regardless of industry, assign
responsibility for inventory optimization
to individuals or groups within separate
business units, though a growing percentage
of respondents (30%) assign responsibility
to a dedicated individual or group
at the corporate or business unit level.
Assignment of stocking level criteria Approximately
50% of survey respondents
across industries indicated some kind of
system-generated or automated calculation
to assign inventory stocking level
criteria, while 24% of all participants still
use manual calculations.
Reassessment of stocking level criteria
Frequency of inventory stocking level
reassessment ranged widely from every
time a purchase is made (21%) to
only when a stock out occurs (5%),
but the largest response category was
other (31%) in which participants
suggested that the reassessment frequency
is driven by numerous factors
that may vary depending on the type
of inventory.
Degree of integration across materials
management and other systems The
largest number of respondents indicated
that the degree of integration between
the materials management system and
work order/asset management systems
is somewhat integrated (44%). This
indicates that challenges and barriers
to fully integrated (the integration level
reported by 36% of respondents) are
common.
Key performance metrics reported in
the survey include:
Inventory performance metrics More
than half (53%) of all respondents across
all industry groups use Inventory Turns
Ratio, and less than a third use Line Fill
Rate (32%).
Asset performance metrics Use of asset
performance metrics varied by industry,
with the most common metrics being:
Mining, Metals Processing & Fabrication
Equivalent Availability Factor
(33% adoption)
Oil, Gas and Petrochemicals % Production
Lost Due to Unplanned Maintenance
(50%)
Power Utilities Equivalent Availability
Factor (16%)
Performance metric results were as
follows:
Inventory Turns Only 9% of respondents
across all industries reported three or
more, and 40% of respondents in oil,
gas and petrochemicals and power utilities
reported less than 1.
Line Fill Rate 45% of respondents
across all industries reported 95% or
more, driven by approximately 70% of
power utilities respondents, but the remaining
responses were evenly distributed
across all other ranges from 80% to
94.99%.
Line Fill Rate for Critical Spares 53% of
all respondents reported 98% or more,
led by approximately 60% of mining,
metals processing & fabrication respondents
and approximately 50% of power
utilities respondents.
Complete results from the survey are available for purchase at www.scottmadden. com.