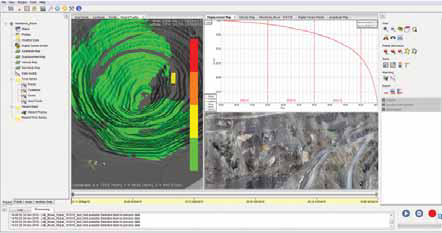
Standard with the IBIS-ArcSAR is the upgraded IBIS-Guardian software. Large sites can upgrade to the
FPM360 suite, which can synthesize data from multiple radars. Above, a Guardian screenshot.
(Photo: IDS Engineering)
Slope Stability Solutions Give
Actionable Data Fast
New and established products compete at accuracy, speed and usability
By Jesse Morton, Technical Writer
Reduced Ambiguity, Increased Versatility
In June, IDS GeoRadar released the IBISArcSAR,
a synthetic aperture radar (SAR)
touted as a world’s first. The literature pegs
it as “the first and only radar in the mining
industry to provide 360° pit coverage
capabilities” by a single unit. “The system
leverages the widest and longest range
(5,000 meters [m]), and the shortest scan
time (360° in 40 seconds, 180° in 20
seconds) as well as built-in global navigational
satellite system” (GNSS) functionality
for auto-geocoding, IDS GeoRadar reported.
It features 10-million-pixel spatial
resolution and an integrated panoramic
high-definition camera for real-time imagery
of pit walls and critical areas.
While those features distinguish the ArcSAR, it is the scan speed that truly sets it apart, Cliff Preston, business development manager, IDS, said. “Typically with radar monitoring, scan times started out, for real aperture radars, anywhere from eight minutes to 30 minutes depending on how big of an area they were scanning,” he said. The IBIS FM, predecessor technology to the ArcSAR, dropped that down from two to four minutes, Preston said. “The ArcSAR is scanning a full 360° in 40 seconds,” he said. “You’ve increased more than tenfold the maximum measurable velocity.”
That means, because the amount of possible movement between each scan is reduced due to the scans occurring in quicker succession, there is less “phase ambiguity,” or essentially guesstimates of the true extent of any movement, Preston said. A typical real aperture radar “can measure a quarter of an inch between each scan,” he said. If the movement between scans exceeds a quarter of an inch, it is difficult to gauge the exact amount. With the ArcSAR, the faster scan time and therefore higher frequency of scans means “a faster velocity of displacement that you can measure,” he said. “We can see closer and closer what is happening during a failure.”
Heightened scan speed also enables the ArcSAR to do double duty, which is exactly what the company sought back when it originally hit the drawing board. “This arose because we saw two different ways radars were used in the market,” Preston said, referring to what he called tactical and strategic use. The former is for monitoring “an area they know is moving,” he said. The latter is for watching a “a much larger area of the mine because you don’t know what else is moving out there so you want to measure all parts of the pit.” ArcSAR “allows them to use it both ways,” Preston said. “If you are a mine site and you are budgeting to buy a radar and you don’t know if you want a long-range solution that is semipermanent, like the IBIS FM, or if you want a shorter range tactical unit, which usually takes more of the engineers’ and technicians’ time because they have to move it around more, now you have a unit that can do both.”
ArcSAR is unique due to the path along which the signal is transmitted. Typically, a SAR transmits along a linear path, a straight path back and forth. That simulates a larger antenna. “What is different about the ArcSAR is that it is moving the antennae in an arc path, and what this allows us to do is to have less moving parts in the system and a higher reliability by the mechanical properties of it,” Preston said. “The other thing it allows us to do is scan in a much wider coverage area.”
Preston describes the arc path as a major breakthrough. “We had to change the way that the data is focused and processed a little bit,” he said. “This is pretty significant in that it is the only radar out there right now that does this.” The benefits are many, he said. First, there is the reliability. “You only have to rotate around one center point now instead of moving a rail back and forth and rotating a rail,” Preston said. Then there is the higher resolution and longer coverage. “It increases the capabilities of the radar across the board doing it this way,” he added.
The radar employs a MIMO (multiple input, multiple output) antenna array to establish baseline elevation. “We can build an elevation model from the scans,” Preston said. “This will be used mostly in areas of the mine where you don’t have a DTM already and you need to quickly start scanning and producing alarms.” Additionally, a high-definition camera enables the system to “sync the images with the data,” he said.
ArcSar features an atmospheric correction algorithm that automatically edits out the effects of weather on the speed of the wave and the resulting data. “It analyzes the data over time to build a model of the atmosphere using what it determines are stable areas,” Preston said. “It uses these to build an atmospheric model and subtract it out of the data.” The model is updated with every scan, he said. The algorithm allows the radar to “have longer shots, to shoot through more atmosphere,” Preston said. “That gives us a higher reliability of the data with less user error.”
IDS offers the Guardian FPM360 software suite that enables a miner to combine and manipulate radar data from multiple units. “One solution combines radar data, prism displacement and slow movement analysis into a single versatile platform without the need to invest in additional software,” the company reported. The primary benefit is ease of use, Preston said. “They don’t have to go to multiple computers to look at different data sets, he added.”
The system allows the user to set up to 10 levels of alarms. The software generates text and email alerts. “You can say stuff like if it moves more than a half an inch an hour I want you to not only send me an email, I want you to send the dispatcher and operations an email saying, ‘hey, watch out for this area,’” Preston said. “Or, here’s a picture of it until a geotechnical engineer calls you to let you know to go back in there.”
The company offers a consultation to prospective customers to determine needs and the details of the possible deployment. Upon purchase, IDS sends personnel to the site to set up the system, a process that can take up to two days. “Once it is set up, we provide a three-day certification course where we go through with the users the software and the system, how to set it up and how to start projects and how to effectively alarm,” Preston said. “Once we feel comfortable that the users know it, they take the short test and we certify them as users so they can set alarms.” The company also offers a support plan that includes software upgrades and patches and 24/7 email and call support.
Last month, the company fielded its first order for the system, which will go to a Chilean copper mine, Preston said. That order was followed shortly by one from an American miner. “They are shipping out of Italy this month and next month.”
Increased Range, Mobility,
Versatility
Reutech’s MSR series of real aperture radar
units have been deployed to mines in
26 countries on six continents for one reason,
“quality,” said Jan de Beer, executive
manager, Reutech. For example, in one instance,
quality data from a unit saved lives
before the system was even commissioned.
At an American mine, “movement was detected on the slope while we were still in the process of completing on-site commissioning and conducting operator training,” de Beer said. “The movement was also detected in the area where personnel were working.” The movement was unexpected, he said, and the data was at first unwanted. Initially, the miner was wary to act. “After long discussions with the resident geotechnical engineer, they decided to warn operations and to clear the area,” de Beer said. “They instructed a brand new hydraulic shovel to move away from the area.” Almost immediately after it exited, the collapse occurred. “You could see that the tracks of the shovel were covered by material as it came down the slope,” he said. “It was a very close call.”
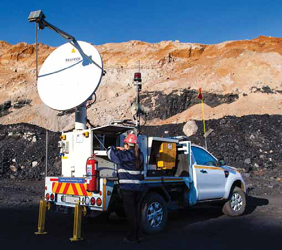
For example, he said, a unit can be configured to be either mobile or stationary. “You can add battery and generator modules,” de Beer said. “You can take that and you can mount it on a trailer or a pickup truck that allows you to quickly move from monitoring a critical mining area to then go and quickly monitor a waste dump and come back to a tailings dam.” A unit can be transported by, for example, a trailer to new site “and within 30 minutes the system can be completely georeferenced and already be doing critical monitoring,” he said. Or, he said, “you can mount it on a concrete block where a permanent solution is required.”
The system is empowered by software functionality, called Rapid Align, which enables quick georeferencing. “If, for example, you have been monitoring a specific area and you take the system away and you bring it back at a later stage, and deploy it in the same vicinity where it used to be, when you scan the same area on the slope, the Rapid Align software will automatically align all the old data with all the new data,” de Beer said. “It is seamless to the user, who does not have to provide manual alignment of data.”
Ensuring the processing of that data occurs instantly, the units feature edge-computing capabilities. “The advanced parallel computing architecture processes data while actively scanning,” the company reported. That is to say the unit itself processes all the scan information, translating the analog data into useful digital information, de Beer said. “That information has been provided from the signal processor to the data processor, where all the information is stored,” he said.
The data can be stored on the unit for a month or more. It is up to the user to determine where to analyze and archive it. “The user can run automatic backup algorithms where the data is transferred from the radar onto a server, and then the user can have data from the last couple of years that he can use for analysis purposes,” he said. “What we do automate is the backup of the data from the radar to the server.”
Edge computing enables the unit to generate alarms. Alarms are set by the user and can be customized and modified as needed. “You can alarm on slopes moving toward or away,” de Beer said. “You can alarm on the velocity of movement. You can alarm on average time windows, to name just a few.”
The system employs the company’s Scatter X software for processing image resolution, correcting for atmospheric changes, and as a user interface. Regarding the image resolution processing, “whereas previously a single data point in range was reported for each scan point, with Scatter X, a magnitude of points is now processed in each range bin and displayed,” the company reported. That means the information conveyed is defined by “millions of data points,” ensuring that “smaller failure mechanisms can be tracked with the highest level of confidence,” the company reported.
To put small failures into perspective, Scatter X leverages data from third-party databases. Data can be tapped from, for example, a wire-line extensometer that captures movement as a crack opens. “What we do is, when we access the database, we actually take into account where the wire-line extensometer is situated and we recalculate what the vector of movement would have been if it was directly in line with the radar,” de Beer said. “And that is what we display to the users so that they can compare apples to apples.” Some of those apples may be subbench failures detected from a distance of 4 kilometers, de Beer said. “Over our full operational range capability, we can detect small failures.”
Meanwhile, million-data-point resolution “combined with shorter scan times allow for better correction of atmospheric effects, yielding a cleaner and more accurate representation of the displacement of the slope surface,” the company reported. The software technically runs multiple weather-correcting algorithms, providing “a variety of options to the client,” de Beer said. For example, “we can allow the system to do atmospheric compensation automatically, or we can designate a specific area in the slope that is not moving,” he said. “The user will select it as a stable region and we will use that as a barometer for trying to determine what the atmosphere is doing.”
The atmospheric correction functionality enables the series to operate in temperatures that range from -50°C to 55°C and up to 5,000 m above sea level. Commissioning is done by a Reutech- accredited technician, and operator training is provided by either a Reutech trainer or a Reutech-accredited distributer. After that, Reutech consults on the processes centered on the system. “We need to come up with a custom solution for them to make sure the system is still maintained based on our factory guidelines,” de Beer said. “We also provide 24-hour call centers and we will bring the support at all times day or night.”
Software That Automates
Analysis
A radar system can capture real-time
data. It can be augmented by imagery
taken by, for example, a drone. Synthesizing
both data sets into models that can be
used to analyze slope failures before they
happen can be accomplished by any one
of a handful software solutions available.
A quick summary of a couple reveals the
types of tools and powers now offered.
A 3-D Model With a
‘Solve’ Button
TAGAsoft’s 3-D slope stability analysis
software (as a service) offering, TSLOPE,
is unique in that it was “designed and
developed as a 3-D system,” said Dr.
Ian Brown, managing director. “Some
3-D slope stability packages build their
models from sections, rather than use
3-D surfaces. In some packages, the user
needs to determine the direction of sliding
before carrying out the stability analysis.”
TSLOPE enables users to conduct
crucial analyses earlier in the timeline,
and to carry it out in 3-D “in minutes,
rather than days,” Brown said.
TSLOPE users can work in 2-D or 3-D, and can, if needed, create 3-D models from 2-D sections. Conversely, the software can automatically generate 2-D sections from a 3-D model, and then analyze them using either Spencer’s Method or the Ordinary Method of Columns. TAGAsoft lauds the software’s automated functionalities, which include back-calculation of failures, calculation of local factors of safety (FoS), searches for critical failure surfaces, and corresponding searches for the critical seismic coefficient.
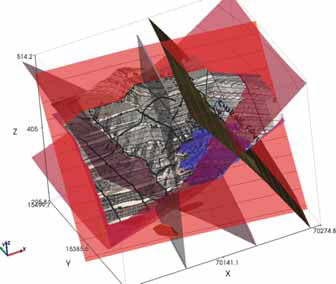
Thus, “there are no limits” to the complexity of the resulting slope stability analysis models, Brown said. “Once all the geometric and strength data are loaded, the slope is discretized into an array of vertical columns that are bounded by the open-pit ground surface and the failure surface,” he said. “Loads can be applied to the model if appropriate.”
The user hits “Solve” to automatically find the direction of least resistance to sliding and to calculate a Factor of Safety (FoS). “TSLOPE provides output that helps understand which parts of the slope are resisting sliding, and which parts are driving the failure,” Brown said. “This then helps the engineer design measures that will improve stability, such as slope drainage, and reinforcement.” TSLOPE findings can be cross-referenced with monitoring data to validate the model.
In analyzing possible critical failure surfaces, arbitrary sections are cut from the 3-D model to provide 2-D surfaces. “The program then discretizes the model into regular 2-D slices, the equivalent of our 3-D columns,” Brown said. “TSLOPE has a search routine to find the circular failure surface (in 2-D) that has the lowest FoS, called the critical failure surface.” Once it is determined, the slope will fail, “the TSLOPE model can be further calibrated by adjusting the shear strengths in the model to give a calculated FoS of one,” he said. TSLOPE can then automatically solve for the slope’s pseudo static acceleration, the critical seismic coefficient.
After a failure, TSLOPE can be used to show the range of strengths required for equilibrium. “If the failure can be reconstructed in a TSLOPE model, we can then use the back-analysis option to provide a cross plot of cohesion versus phi (for Mohr Coulomb strength) for a range of factors of safety, or for two of the four Generalized Hoek-Brown parameters if using that nonlinear failure criterion,” Brown said. “This is an important feature.”
By using TSLOPE, a miner can do complex modelling and analysis in-house, reducing the need for expensive consulting services, Brown said. “Management are able to empower their staff to carry out complex slope stability calculations with a simple work flow that fits into the technical services environment of a mine site.”
TSLOPE is licensed on a time basis, “with modest pricing,” Brown said. “In response to customer demand, we have made a day license available, as well-organized users are able to get their slope stability analyses completed in a short time.” The program is downloaded from and the licensing is arranged via the company’s website, www.tagasoft.com. A two-week trial is free.
Affordable, Fast Solutions
Released in late June, Rocscience’s Slide3,
3-D slope analysis and modeling software,
is pitched as more than an update to
best-selling predecessor software. Company
literature reports it leverages parallel
processing, and is more than 10 times
faster than the competition. Not only fast,
it cranks out robust models and features
sophisticated analytics. The software can
automatically calculate the safety factor of
bullnoses, large open-pit excavations and
the effects of buttressing. “To build Slide3,
we leveraged the platform of RS3, our 3-D
finite element analysis software, which
allowed us to create the complex 3-D geometries
required for slope stability models,”
said Dr. Thamer Yacoub, president,
Rocscience. Other features include easeof-
use, calculation “of any failure direction
without user definition,” and “superior
methods for locating critical slip surfaces
of any shape,” the company reported.
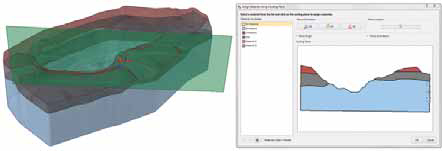
One such solution is the Weak Layer function, which generates models of potential failures caused by the intersection of joint planes and other discontinuities. Rocscience literature states the software “will generate a multi-planar wedge failure surface and calculate the safety factor.” The tool “covers cases when you have faults, factures, or joints in your rock mass and you want to study more complicated wedge failure for slopes,” Yacoub said. “This ability to examine different failure mechanisms more accurately leads to a more precise FoS.”
Another solution is dubbed Surface Altering Optimization, which enables automated modeling of potential critical slip surfaces with “minimal user input,” the company reported. First, “initial trial surfaces can be generated using Spheres or Ellipsoids,” Rocscience literature stated. Yacoub said “the surface is initially approximated into non-uniform rational basis spline.” Next, the literature continues, “Surface Altering Optimization continues to search for a general failure surface with a lower safety factor.” Yacoub elaborated. “Using a non-linear optimization method, we modify the dimension and location of the control points,” he said. “By modifying these points, we modify the surface shape, and with this change of geometry, the FoS of the failure surface is being changed, helping to find the lowest FoS.”
Contributing to ease-of-use, the software automatically determines failure direction in 3-D, the company reported. “It is not necessary for the user to specify a failure direction,” the literature stated. Yacoub explained that “this feature is built right into the tool, which has the same functionality regardless of your license type.” By not being limited to two slip directions, the customer attains actionable technical data, he said. “As soon as the user constrains a failure direction, it reduces the capacity for a most-accurate safety factor,” he said. “There is a naturally higher tendency for a slip surface to slide along a particular direction, and Slide3 uses the available input parameters in the equation to help determine this direction.” Findings present in the Results section. “A slip surface vector can be added to the model to understand the direction of failure,” Yacoub said.
Because of its relative low price, the software provides a unique opportunity for consultants and smaller operations to conduct 3-D slope analysis, Yacoub said. Better modeling can mean, among other things, cost savings and improved safety. “2-D models of open-pit mines are intrinsically conservative, whereas 3-D models allow for increased accuracy,” he said. For example, “3-D models illustrate the likely extent of a slip surface and account for the curvature of the slopes,” Rocscience reported. That simply “cannot be fully represented as a 2-D slope, since these are non-extruded models and vary significantly through each cross-section,” Yacoub said. “A 3-D tool will allow you to have the full picture of this type of failure surface, which is particularly valuable in open-pit mine models.”
Since launch, the software has generated “great interest from clients around the world looking to enhance their modeling and analysis capability,” Yacoub said. “Mining customers that are already using Slide3 are finding that the tool allows them to deploy a broader range of solutions.”