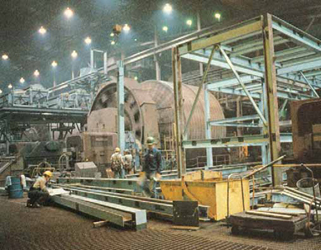
Business for iron ore miners on the Mesabi Range improved throughout the
1980s. Cleveland-Cliffs invested $30 million in operational improvements at
the Tilden mine (above) in 1988-1989.
Global Competition Grows in the 1980s
Recovering from economic issues and geopolitical tensions, miners in the developed
world compete with those in the developing world
By Steve Fiscor, Editor-in-Chief
In the 1980s, capital spending began again in earnest. The oil shocks of the 1970s had slowed economic growth, which reduced capital spending. By the mid-1980s, the industrialized world began to invest in modernization programs. Similarly, governments realized that infrastructure such as bridges and roads were in disrepair. These investment programs increased demand for natural resources and spurred activity for the mining sector. Then, a U.S. stock market crash in 1987 caught many investors by surprise. In the United States, capital spending still grew 10.6% despite the stock market crash. A relatively low exchange rate kept exports strong, while the domestic economy remained healthy. Third World debt, however, remained a problem as did the U.S. budget deficit.
The mining industry saw demand build to a crescendo in the late 1970s and then fall off at the beginning of the 1980s. Throughout most of the decade, when not deviating wildly with market uncertainty, gold was locked in a bear market. Because the United States had lower ore grades, higher wage costs and more severe environmental restrictions, many thought U.S. mining companies could no longer compete. The cover story of the December 17, 1984, edition of Mc- Graw-Hills Business Week declared the U.S. mining industry dead. McGraw-Hill at the time also published Engineering & Mining Journal (E&MJ).
The article, The Death of Mining in America, noted that the 1983-1984 recovery largely bypassed U.S. producers of copper, iron ore, molybdenum, and lead and zinc. It documented how the U.S. mining industry had shrunk from an $8.9 billion industry to less than $5.9 billion in four years. The largest copper producers (Kennecott, Asarco, and Phelps Dodge) were all operating in the red. Oil companies that had rushed into minerals in the 1970s were now abandoning it. Iron ore miners on the Mesabi Range were idling capacity and laying off workers. In a few short years, American miners proved them wrong. As part of the continuing celebration of the 150 years of E&MJ, we peer into the 1988 and 1989 archives to gain perspective on what transpired during the 1980s.
U.S. Copper Recovers
A sharp rise in copper prices in 1987
worried industry observers who saw similar
price spikes in 1973 and in 1979.
Both of those price run-ups were followed
by even steeper declines. When
1988 began with copper prices at about
$1.45/lb on the London Metal Exchange
(LME), fears of a precipitous drop were
widespread. A decline did occur, but the
copper market held well above the 1987
average of $0.80/lb. Toward the end of
the year, the market rose sharply again.
On a long-term plot of copper prices,
however, the late-1980s appear as a
plateau rather than a spikea tempest
in a teapot.
U.S. copper mine output in 1988 was estimated at 1.6 million short tons (st) compared with 1.58 million st in Chile. The U.S. had recaptured, at least temporarily, the distinction of being the worlds premier copper-mining country. It lost that distinction to Chile in 1982.
A major factor in the increased U.S. copper production was the first full year of operation of the modernized Bingham Canyon pit. BP Minerals America had completed $400 million in improvements. Not long afterward, British Petroleum decided to sell BP Minerals to Rio Tinto-Zinc Corp. (RTZ, pronounced R-Tzed at the time) in the United Kingdom. The transaction made RTZ (now Rio Tinto) the worlds largest privately held copper company, rivaling Corporación Nacional del Cobre (Codelco) in Chile.
RTZ added Bingham Canyon to a group of assets that included an interest in Olympic Dam in Australia; Bougainville in Papua New Guinea; Palabora in South Africa; Highland Valley in Canada; Neves Corvo in Portugal; Rio Tinto in Spain; and the proposed Escondida project in Chile.
Other major developments occurred in U.S. copper industry during this period as well. Cyprus Minerals purchased the Inspiration operations in Arizona. Magma Copper completed a new smelter at San Manuel. Asarco expended the Mission mine in Arizona, and Phelps Dodge continued to build on its electrowinning capacity. Together, these five enterprises (Phelps Dodge, Asarco, Magma, Cyprus and RTZ) added an aggregate capacity to mine more than 1.5 million st/y of copper, and they had managed to substantially lower production costs compared to the beginning of the decade.
Nevertheless, Chile again overtook the U.S. as the worlds premier copper miner. Assuring that this will happen is the completion in 1988 of arrangements for financing and marketing of the Escondida project, E&MJ reported. This huge new mine will require an investment of $1.1 billion to yield about 320,000 metric tons per year (mt/y) copper in concentrates, beginning perhaps as early as mid-1991. Increased production was also expected from Codelco, which in the late 1980s was failing to meet its production targets because of grade problems at Chuquicamata and El Salvador, difficulties with a new smelting technique at Chuquicamata, and operating complications arising from rockbursts at El Teniente. By the end of the 1980s, Codelco was trying to grow copper production from a little more than 1 million mt to 1.24 million mt.
Two large copper mines came online in 1988: the Neves Corvo mine (115,000 mt/y) in Portugal, owned 51% by the Portuguese government and 49% by RTZ; and Olympic Dam (45,000 mt/y) in South Australia, jointly owned by Western Mining and RTZ. Olympic Dam was also expected to produce 1,500 mt/y of uranium yellowcake and 25,000 oz/y of gold.
The increase in mine production and a decline in consumption put the supply-demand fundamentals back into approximate balance. As visible stocks remained small, the price of copper was strong. The average annual price for copper in 1988 was $1.18/lbthe highest on record. However, if it were adjusted for inflation, it fell in line with prices prevailing during the l950s and 1960s. At the end of the decade, copper miners were posting greater profits since the beginning of the decade. The tide changed in the 1990s.
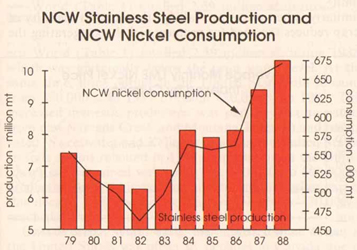
Steel Recovery Carries Moly
and Nickel
An unexpectedly strong steel recovery
began in the latter part of 1987 and continued
through 1988. Analysts projected
that 1988 would be a good year for
the U.S. steel industry and it surpassed
1987 by a significant margin. The U.S.
produced 100 million st of raw steel
compared with 88.5 million st in 1987.
Earnings surpassed the $2 billion mark
for the first time since 1981, said William
T. Hogan, S.J., Industrial Economics
Research Institute, Fordham University.
Furthermore, for the first time in a
number of years, the industry operating
rate surpassed 90% of capacity for several
weeks.
Demand for stainless steel in the U.S. and abroad was strong and building momentum. Total Western World stainless- steel production in 1988 hit another record at 10.7 million mt, representing a 16.3% increase year-over-year (yoy). During the same period, U.S. stainless- steel ingot production surpassed the 1979-level peak, reaching 2 million mt. This was 8.6% higher than in 1987. U.S. mill shipments of stainless products in 1989 increased by more than 13%.
The increasing demand for stainless steel had a huge positive impact for nickel miners. When the LME nickel price closed at $4.24/lb on December 31, 1987, no one believed, even in their wildest dreams, that prices in the next three months could go to $10.84/lb, said Marguerite Manshreck-Head, manager, marketing research, Falconbridge Ltd. What we have just witnessed was a unique set of circumstances that pushed nickel prices to record heights.
On a volume basis, the bulk of the world nickel production increased substantially (35%-40%) during the 1980s and much of the growth originated from Inco and Falconbridge. The Rustenburg and Impala operations in Africa increased their combined nickel production as a result of higher platinum production.
While the nickel miners struggled to keep pace with demand in the late 1980s, the most notable problem was delivery. In December 1987, E&MJ reported a dispute between the Dominican Republic and Falconbridge Dominicana (Falcondo), which resulted in a virtual embargo on shipments from the island during the first half of 1988. The absence of Falcondo, which supplied about 5% of Western World demand for primary nickel, had a negtive impact on the market. There were other production shortfalls at Outokumpu in Finland, at PT lnco in Indonesia, at Western Mining in Australia, at Tocantins and Codemin in Brazil, and at Cerro Matoso in Colombia.
Making up the difference between Western World production and Western World deliveries were purchases from Socialist Bloc origin, i.e., exports from the USSR and Cuba. It should also be noted that during the late 1980s, China began to transition from a nickel exporter to a net nickel importer.
Silvers Wild Swings
The 1980s opened with the Hunt brothers attempting to corner
the silver market. The move drove the price of silver from roughly
$5/oz to $50/oz. When the Hunt bothers missed a margin call
on March 27, 1980, aptly dubbed Silver Thursday, the price
dropped to $11/oz. They effectively created a silver bubble that
bursts and rocked financial markets.
With the exception of 1980, silver traded on average between $5/oz and $7/oz. Photography was the largest use for silver at the time, accounting for about 45% of the total. This use was expected to grow at a rate of 3% to 4% annually. The electrical and electronics industries continued to be the second largest outlet, using about one-third the amount consumed by the photographic industry. Coinage continued to be an area of considerable demand, reaching about 30 million oz/y. The U.S. Eagle coins gained popularity.
As 1987 drew to a close, zinc market fundamentals were positive, suggesting some upward pressure on price in 1988, said Edward M. Yates, manager, market research for Cominco Ltd., a leading zinc producer at the time. Only in our wildest dreams could anyone have predicted the LME zinc price would close 1988 at 73¢/lb, compared with the January 4, 1988, opening price of 38.9¢/lb.
In 1988, Western World zinc consumption surged by 5.2% (263,000 mt) to a new record of 5.3 million mt. Since 1980, growth had been 2.4%/y, and the 1980-1988 consumption increase totaled 820,000 mt.
In 1988, Western World zinc mine production declined 3.2% to 5.18 million mt (metal content), a fall of 169,000 mt of zinc content. Perus economy was deteriorating, with hyperinflation at 1,722% in 1988, and the mines were unable to secure supplies. Labor issues ensued, further complicating the situation. At the time, Peru was the Western Worlds third largest mine producer (after Canada and Australia), and it was posting a 20% decline (118,000 mt). Mines could not keep pace with zinc demand.
Auto Market Consumes
Record Levels of Lead
Lead consumption by the Western World
grew to record levels by the end of the
1980s despite the market erosion fears associated
with its diminished use as a gasoline
additive. The decline of that once
important market has been fully offset by
dramatic growth in the demand for lead by
the battery industry, which now accounts
for nearly 60% of all lead consumed in the
Western World, said Alan S. Kafka, manager,
base metal sales, Asarco Inc.
This trend was particularly evident in the U.S., E&MJ reported, where the battery industrys consumption of lead reached a record 1.04 million st in 1988 and accounted for 78% of total U.S. consumption. In comparison, the battery industry only consumed 775,000 st of lead in 1982, or 65% of all U.S. domestic consumption.
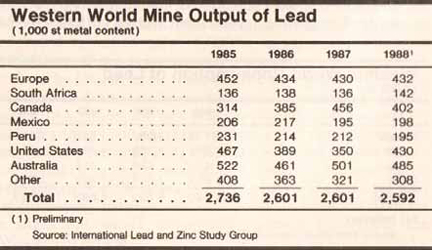
Worldwide consumption of lead consistently grew from 4.4 million st in 1985 to 4.7 million st in 1988, which was a new record. The difference between consumption and mine production was offset by the recycling of lead-acid batteries.
Gold Prices Deviate Radically
In the 1980s, South Africa was still
the dominant gold producer, but other
regions began to post significant gains,
especially Nevada. Gold started the decade
with a high level of price volatility.
All five major producersSouth Africa,
the U.S., Canada, Australia and Brazil
recorded increases in mine production.
Chinas immense gold production continued
unnoticed by E&MJ.
In January 1980, gold reached a high of $850/oz in reaction to the uncertainty in the world. By midyear, it dropped below $500/oz before pushing back to $700/oz. The price of gold steadily declined to less than $300/oz by mid-1982. It rose again to more than $500/oz in early 1983, and then fell to less than $300/oz in January 1985. The yellow metal rose again to $500/oz, and then steadily dropped to about $400/oz by the end of the decade.
Ore grades continued to decrease in South Africa. As an example, gold production in 1988 increased by some 14 mt to 619 mt from 605 mt in 1987, an increase of a little more than 2%. To maintain that level, South Africa gold miners milled a record 112.7 million mt of ore, 4.7% more than the previous year. In addition to declining grades, South Africa was also battling inflation, which drove mining costs higher.
Gold production in the United States continued to surge. In 1988, the U.S. produced 193 mt of gold, a 25% increase over 1987. Nearly 50% of U.S. gold then came from Nevada, where heap leaching enabled the processing of previously uneconomic deposits with average grades of less than 1 g/mt. New technologies also helped U.S. gold miners control costs. They extracted gold at a cost of less than $220/oz, which made them the lowest- cost operators in the world. A total of 45 new mines were scheduled to come online in the late-1980sthat output would expand to more than 300 mt/y by the mid 1990s.