Source (for all data): Raw Materials Data, Stockholm, Sweden, December 2011
E&MJ 's Annual Survey of Global Mining Investment
The rate of new project announcements slowed in late 2011. Is the boom in mining
investment starting to fade, or is this just a momentary adjustment?
By Magnus Ericsson and Viktoriya Larsson
During 2011, 136 new mining projects with a total projected value of $74 billion were registered in Raw Materials Group's Mines/Projects database. Overall, investment activity in 2011 was higher than in 2010 but the most recent developments raise ques-tions for the future. As mentioned above, however, it is too early to draw far reaching conclusions about the state of the mining indus-try from this material, as its annual figures remain healthy.
It is now more difficult to predict the industry's 2012 invest-ment trends than it has been for both 2010 and 2011, but RMG remains optimistic in the long-term outlook for the sector. Population growth and economic development in the emerging economies are positive and provide a strong base for continued growth in metal demand: hence the need for increased mine pro-duction and for new-project investment.
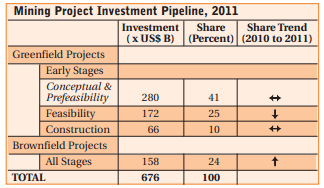
At the end of 2011, the total value of announced investment in the global mining industry's project pipeline as recorded in RMD Metals Mines/Projects database was $676 billion, an increase of more than 20% compared with investment status at the end of 2010. In the previous year, growth was of the same order of magnitude, but the quick recovery of 2010 reversed in late 2011. RMG, along with most observers, expected the recov-ery to continue throughout 2011 but the European debt crisis, coupled with some hesitation concerning metal prices, slowed mining investment.
The number of projects announced in the third and fourth quarters of 2011 declined when compared with the same period in 2010 and the number of new projects announced annually has remained static since 2009. However, caution must be exercised when estimating the total amount in the investment pipeline, as there is a tendency for the pipeline to accumulate projects that are no longer active. It is sometimes difficult to determine when a marginal project is to be considered abandoned and should be taken off the list. Currently, RMG removes projects about which there has been no news within eight years of first mention.
Also, absolute figures at each year end are not directly compa-rable, primarily because it is impossible to ensure that all possible projects are included. For example, due to a publishing schedule change by E&MJ, this year's survey was compiled slightly earlier than in the past, thus posing the possibility that it may not include some projects announced late in 2011. It's also possible the apparent decline in the number of projects listed in the survey could result from decreased coverage of the very smallest projects. However, our conclusion that mining investment has slowed is firm, despite these uncertainties. Our expectation from a year ago, of a continued increase in the number of announced new projects all through 2011, proved to be too optimistic.
Project Costs on the Rise
The trend of increasing investment costs, which we previously
highlighted in late 2010, has continued through 2011. We also
noted previously that many projects are being expanded when
moving from the feasibility to the construction phase and this tendency continued in 2011. Cost increases are thus not due entire-ly to increasing unit costs but also to rapid growth in metal
demand. Additional important cost drivers are more complex ore
bodies, deeper lying deposits with lower grades and more remote
locations of new mines. Costs for equipment and construction
work seem to be increasing again and many equipment suppliers
are operating near full productive capacity.

Metal prices fell in the second half of 2011 but remain comparatively high, particularly when taking into account the three most economically important metals: iron ore, copper and gold. These three metals together account for 73% of the total value at the mine stage of all metals produced globally. Given the con-tinued strong metal demand from China, India and other emerging economies RMG does not expect metal prices to drop dramatically in 2012—on the contrary, we believe they will hold up fairly well.
Although the investment pipeline continued to grow in 2011, the inflow of new projects slowed in the second half, while the share of projects at the feasibility stage declined for the second consecutive year. This may be due to the very sharp drop in explo-ration activity in 2009, which resulted in a smaller number of early-stage projects being launched during the height of the finan-cial crisis, but it is difficult to determine with certainty at this stage. The share of projects at the construction stage also declined slowly during 2011 when compared with 2009 and 2010, but investment in brownfield projects increased in absolute terms while the relative share has increased marginally. Brownfield proj-ects require less funding, with the average brownfield project val-ued at $322 million, while the average investment for greenfield projects is $623 million. Although this statistical comparison does not take into account the capacity of each project, our view is that brownfield projects also are generally more cost-effective when measured on a capacity basis.
However, it is difficult to accurately monitor the progress of brownfield projects from project studies to construction because they are often carried out internally and quickly, without public disclosure. Our total investment figure for projects under con-struction is undoubtedly an underestimate, particularly for this project category. Typically, a project takes at least a year—usually even longer—to develop, depending on its size, location, existing infrastructure, availability of financing and many other factors.
All of this year's survey statistics are based on projects with an announced investment estimate. The RMD Metals database also includes approximately 1,800 projects—mostly in the conceptual stage—for which no investment figure has been announced. The investment total for all mining projects, including projects for which no investment estimate has been published, is therefore larger than the $676 billion recorded at the end of 2011—but it is difficult to estimate how much larger. If it is assumed that the projects without published investment estimates have a similar cost structure to those projects whose costs are known, the total figure would increase considerably. It could, however, also be argued that unannounced-project costs are lower, as most mega-projects are conducted by public companies that must publicly disclose all significant expenditures. If this is indeed the case, the total figure would be smaller. Projects involving metals not covered in this survey but included in the database also represent a spe-cific investment total but one that is estimated at a much lower level than the major metals represented in the survey.
Many of the early stage projects included in this year's total investment figure will not, or at least not during a period of low metal prices, pass from the conceptual study phase to the con-struction stage for a number of reasons, including insufficient profitability, inadequate ore reserves, failure to secure financing, technological problems or excessive political risk. However, histor-ically RMG has observed that 60%–75% of all projects announced will materialize during a three-year period.
Iron Ore, Gold Grab More Investment Dollars
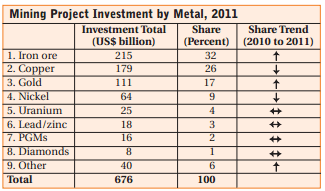
Iron ore, copper, gold and nickel, in that order are the most impor-tant investment targets for mining companies. These four metals
account for 84% of the total project pipeline. They also dominate
the mining business in terms of the total value of its output; they
are cumulatively valued at $490 billion or 79% of the total value
of all non-fuel mineral production during 2010. Iron ore invest-ment surpassed that of copper with a project pipeline of $215 bil-lion—compared with $179 million for copper—while gold and
nickel are at much lower levels ($111 billion and $64 billion,
respectively), distantly followed by a group of metals that include
uranium, lead/zinc and PGMs, valued at $15–$20 billion.

Gold projects are typically relatively small, in terms of invest-ment, but the number of projects is high. In 2011, 53 new gold projects were announced, not surprising considering the record high gold prices of 2011. Newly announced iron ore projects totaled 21 in 2011, along with 24 new copper projects. The aver-age iron ore project investment figure was about $2 billion, with the smallest projects at $200 million and the largest more than $10 billion. Average investment per gold project was about $250 million in 2011, up from $205 million in 2010.
Iron ore's share of total new project investment announced in 2011 remained stable at 47%-48% reflecting the high price level for iron ore and continued strong demand mainly in China. Iron ore projects are huge in all respects: the four largest projects of all cat-egories are iron ore with an investment amount of more than $10 billion for each of them. The Olympic Dam copper project is the fifth largest and the largest non-iron ore project. The continu-ing demand growth for steel and the concomitant high prices paid for iron ore point to a strong increase in iron ore production during the next three to five years. However, in recent months there also have been announcements of project delays and postponed start-ups, indicating that the risk of iron ore production over-capacity developing—at least during the next couple of years—is low.
The number of nickel projects and investment in the pipeline declined as a result of the bleak outlook for the nickel market. An increase in new silver projects noted in 2010 dwindled to nothing in 2011. Interest in uranium has continued to grow although the Fukushima accident might dampen investor interest again. Lead/zinc projects' share of the total pipeline has continued to decrease, as has PGMs. Rare earths, which attracted a lot of inter-est in 2010, also subsided in 2011. Iron ore was really the only winner in 2011.
Latin America Slips, but Stays on Top
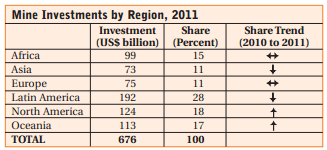
Latin America maintained its leading position in attracting mining
investment in 2011, but its share of the total investment pipeline
fell to 28%, the same level recorded in 2009 and a figure that is
no longer more than double that of investment in any other region,
as was the case for Latin America in 2010. North America's share
grew to 18% and Oceania's to 17%.

Latin America's project pipeline includes many more very large projects than any other region; for example, 56 Latin American-based projects involve investments of more than $1 billion, com-pared with 33 projects in Oceania, 20 each in Africa and Asia, and 17 in Europe (12 of which are located in Russia and the Ukraine, with the rest in Sweden and Greenland).
Europe has continued to move up and has passed Asia as the least favored region, but its relative share remains 11% of the total at $75 billion. The rising investment trend there, with more new projects in Finland, Sweden, Greenland and in 2011 also in Norway, has strengthened. The European Commission continues to follow the development of the local mining sector closely and although the new Raw Materials Initiative has not, to date, result-ed in any major new support initiatives for the European mining sector, the conditions for the mining industry have not deteriorated. In Africa, the African Union has continued work on the African Mining Vision, which aims to create conditions for mining invest-ment in Africa that enable both the host countries and the investors to benefit from them. The African countries want to take advantage of strong demand from China to create a competitive situation between traditional investors from Europe and North America and new Chinese investors.
U.S. as a Fading Player? Not so Fast…
The growing trend toward resource nationalism has manifested
itself in various ways in both emerging and developed mining
countries. Demand for increased royalties or taxes on "super prof-its" have been widespread, including established mining nations
such as Australia. Calls for increased state ownership or at least
increased ownership by domestic owners have not been limited to
emerging economies such as Zimbabwe and Namibia; in Finland,
the idea of establishing a new state mining company has been dis-cussed among politicians.

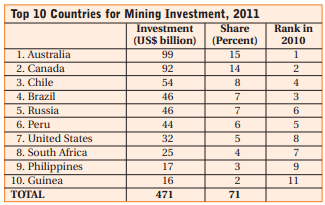
Australia maintained its position as the number one nation for mining investments. The iron ore boom continues there and of the top 20 projects in Australia, 13 are in iron ore and 11 of them require investment of more than US$1 billion. Canada, in second place, has a much wider mix of projects, including several gold and base metal projects among the top 20, along with five iron ore projects, six gold projects and two copper projects on the list.
The combined announced investment value of projects in those two nations is slightly less than $100 billion. The rest of the Top 10 list changed considerably in 2011. Chile moved up to rank third, with a total of $54 billion. Brazilian mining invest-ments fell in 2011 and only accounted for 7% of the total or $46 billion. Russia recaptured fifth place in 2011, and even though the number of Russia-based projects decreased, the investment volume increased by 18%. The United States showed the strongest growth over 2011, up by 38% and rising from eighth place to seventh. Mexico dropped out of the Top 10 and was replaced by Guinea, where three giant iron ore projects involve a total investment of $16 billion.
Following the Top 10 in descending order are Mexico, Argentina, Papua New Guinea, China, Indonesia, Sweden, Democratic Republic of Congo and Kazakhstan, each with a port-folio of projects between $8-$13 billion. It should be noted that some projects are much bigger than others, and one new project announced or one major project completed in a small country can make a big difference in the position of this country relative to oth-ers. Thus, not too much importance should be put on relative posi-tions outside the Top 10.
The figure for China is most certainly an underestimate, since many of the projects run by state-owned companies are never reported in such a way that they reach the international mining press. With comparable reporting from China there is no doubt that the country would be high up among the top 10 countries. Chinese projects are mostly small, with an average investment value of $170 million per project, compared with Canada where the average project is currently valued at $695 million.
Chinese mining investment activity outside China is still mar-ginal. China's scramble for resources in Australia, Africa and elsewhere, which has come into clearer political focus, still repre-sents minimal investment values despite rapid growth in recent years—but it is growth from an almost zero start position. It will take years before Chinese companies become powerful global players in the mining industry, but it will eventually happen.
One of the political goals set for the Chinese mining industry in 2011 is to strengthen control over its mines in foreign coun-tries, but it has proven difficult to meet the very ambitious targets set by central authorities.
|
About This Survey E&MJ's annual review of metal mining projects is compiled from Raw Materials Group's Raw Materials Projects database (see demo at www.rmg.se). The full database is available from RMG on an annual sub-scription basis and includes more than 3,150 projects as of January 2012, ranging from those in the prefeasibility stage to those currently under con-struction. Of the total number of projects listed in the database, more than 1,300 include detailed descriptions of resources/reserves, grades, planned investment cost, and completion date. This survey includes all countries with known projects. In the process chain from ore to metal, its main focus is on the mining stage. Pure smelter projects are not listed. In some cases, however, where the process is fully integrated from mining to refining, such as acid pressure leach hydromet-allurgical nickel projects, all stages are included. Eligibility for a full listing requires each project to have an announced investment cost estimate, reserve/resource data and an estimated annual pro-duction figure. Comparability of information from different companies, coun-tries and regions varies, as specific project information or definition may be unclear for various reasons, or the project may also involve large unreported infrastructure costs. Raw Materials Group attempts to resolve these factors, but cannot rectify all discrepancies arising from definitions and comparability. Information contained in the survey is global in scope. However, it should be noted that completely accurate coverage of some regions is dif-ficult to attain due to lack of information or corporate reporting standards and requirements. In total, mine projects are included from more than 70 countries and the survey's aggregate figures are considered to reflect over-all investment trends in the mining industry reasonably accurately. For more information, visit www.rmg.se or call +46-8-7440065 |
