E&MJ’s Annual Survey of Global Mining Investment
It appears that the drastic slump in mining investment has bottomed out
By Magnus Ericsson and Viktoriya Larsson, Raw Materials Group

It is not only in the number of projects and the investment costs for these projects that a decline is noted. Given that the slowdown of the investment activities in the mining sector started long before the financial crisis, as RMG noted in the 2008 survey, there is also a decline in the number and volume of projects that have been completed. The previous trend toward larger projects also ended—from an average of $190 million in 2006, to $512 million in 2008 but down to $325 million in 2009. Problems obtaining financing for new projects are obvious.
At the same time, unexpectedly strong demand for metals and high prices for gold, copper and iron ore provide hope for a swift recovery for project investment, most likely toward the end of 2010.
Investment Pipeline Growth:
Good but not Great
Total funding in the global mining industry’s project pipeline, as
represented in RMG’s database, was $465 billion at the end of
2009. This figure represented only a 14% increase compared with
the total at year-end 2008, indicating how difficult 2009 was for
the industry.
Be aware that absolute figures at each year-end are not directly comparable, primarily because it is impossible to ensure that all possible projects are included. These uncertainties should not, however, overshadow the clear conclusion: investment activity in the mining sector dropped dramatically in 2009. However, RMG is convinced that investment should increase sooner rather than later and most probably already during 2010.
Cost estimates of many projects are updated during the year and the trend we have noted earlier with project costs escalating continues, although at a much lower pace. We also noticed that many projects are being expanded when moving from the feasibility to the construction phase and all cost increases are not necessarily linked to higher unit costs. This is due mostly to the development of remotely located new mines with deeper, more complex orebodies and possibly lower grades as well as to increased costs for construction and equipment.
RMG’s oft-repeated conclusion that metal prices will be underpinned by a rising long-term investment cost level still holds, but the level of these long-term prices has dropped. RMG does not anticipate metal prices will drop to the level of the early 2000s, however. In today’s market there is even an upside developing if metal demand continues to soar as it did during latter 2009.
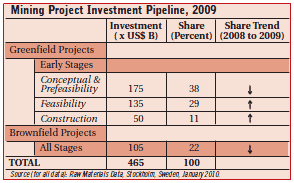
The status of the investment pipeline illustrates the tough phase the mining industry is going through. The inflow of projects has been reduced as a result of the difficult situation the major project generating sector of the industry—junior companies—is experiencing. The slowdown is also visible in the growth of the volume of feasibility-stage projects that are not proceeding to the construction stage because of lack of financing.
The investment value of projects under construction grew in 2009 to $50 billion, compared with $37 billion in 2008, primarily because projects were delayed to wait for market demand to return to previously expected levels and also to find necessary funding. Investment in brownfield projects totals $105 billion, which is constant in absolute terms but slightly down in relative terms. However, it is difficult to accurately monitor the progress of brownfield projects from project studies to construction because they are often carried out internally and quickly, without public disclosure. Thus, our total investment figure for projects under construction is undoubtedly an underestimate, particularly for this project category. Typically, a project takes at least a year—usually even longer—to develop, depending on its size, location, existing infrastructure, availability of financing and many other factors.
Most of the early stage projects included in the $465 billion total will not, or at least not a period of low metal prices, pass from the conceptual study phase to the construction stage for a number of reasons, including insufficient profitability, inadequate ore reserves, failure to secure financing, technological problems or excessive political risk.

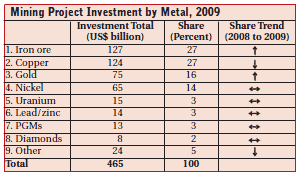
In 2009, gold, not surprisingly considering the high price levels prevailing, shot back into investor focus. In terms of the new investment amounts gold, copper and iron ore were all around $8–$9 billion, but gold dominated the number of projects announced with almost 40 projects, more than double the number associated with iron ore and copper. It is clear that iron ore’s growth trend has been broken. Out of the total amount of investments in new projects presented in 2007, 2008 and 2009, the share accounted for by iron ore has continuously gone down. In 2009, new iron ore projects accounted for 25% and $8 billion, while in 2007 those figures were 50% and $27 billion.
This illustrates both the difficulties of the entire mining industry as well as an end to the very strong project growth in iron ore. No new giant project like Vale’s Serra Sul in Carajas, Brazil—by itself estimated at more than $10 billion—has been announced and it’s unlikely that any similar project will materialize in the near future. Copper share of the pipeline decreased, with only 18 new projects announced totaling less than $8 billion. This is a bit surprising considering the relatively good level of copper prices during the year. Interest in investing in PGM capacity has fallen dramatically and only two new, relatively small projects were announced.
Gold projects are generally smaller than copper projects, with the average gold project valued at slightly more than $200 million— much less than the $500-million-plus average project size for copper. This is due to the fact that it is still possible to find small but high grade gold deposits that can be mined profitably by junior or mid-sized companies, while most new copper projects are huge, low-grade open-pit operations, typically far away from existing infrastructure. Further, given the structure of the gold sector which includes many juniors as well as small and medium-sized producers, there is a tendency toward smaller projects which are easier to finance. The cost of an average iron ore project is larger than that of an average copper project, and continued to grow in 2009 from $670 million to $750 million. Nickel projects used to be the largest of them all at some $660 million, as new laterite technologies are technically more demanding and the ore grades often low, requiring haulage of large volumes of ore and waste, but iron ore projects have now surpassed them. And, the average uranium project is now priced at $328 million, much more than the 99 zinc projects in the database that average $140 million.

Strongest Growth in Asia
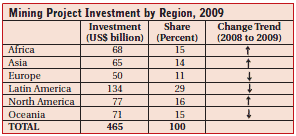
Mining investments were spread more evenly around the world in
2009 than they were in 2008. Latin America is still at the top of
the list for many investors, as it has been for several years. Its
share of total investments fell, however, to less than 30%. The
strongest growth is evident in the Asian region with many—admittedly
often smaller than average size but a larger number of
them—new projects in China and India. There are also a growing
number of large projects controlled and operated by Chinese mining
companies in other countries. The Ainak copper project in
Afghanistan, controlled by Chinese interests, illustrates not only
a deliberate Chinese policy to secure natural resources abroad
but also shows that Chinese investors are forced to take higher
risks than their competitors in that they often have to find investments
in marginal countries with difficult political situations and
a lack of infrastructure. North America has moved into second
position while Oceania, representing mainly Australia and Papua
New Guinea, fell from 17% to 15% during the year. Africa’s share
increased slightly during 2009 to 15%, giving new hope for a
slow revival of its mining sector. Following a period of growth,
Europe's share of the investment pipeline decreased partly due to
the gradually worsening investment climate in Russia where local
control over natural resources has again become a leading political
theme.
Australia Fades, Canada Flourishes
In the analysis of the two last RMG project surveys, we have discussed
whether there is a trend toward “spreading mining
investments more evenly across the globe.” With the results of
the 2009 study in hand we think it is clear that the trend
toward additional producer countries is becoming important
both due to world market demands as well as for domestic internal
metals use.

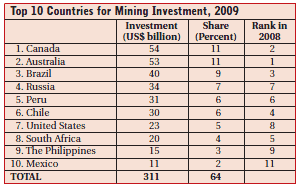
South Africa continued its downward path and has been overtaken by the United States. It is interesting to note that in spite of the high costs and antiquated mining legislation in the U.S., its low country risk still makes it an attractive investment target. New projects announced in 2009 in the U.S. accounted for 14% of the total, almost double the growth reported for Australia. But, except for the growth in the Canadian and U.S. project pipeline, there is not much change in the amount of investment recorded for most countries. In Russia, for example, the total dropped slightly as almost no new projects entered the pipeline in 2009. This shows that the ranking of countries is affected by relatively small changes in the inflow and outflow of projects and caution should be exercised when interpreting these data.
Below the top 10 rankings are Indonesia, New Caledonia, Papua New Guinea, China, Guinea and Argentina in that order, each with a portfolio of projects between $5–$10 billion. The figures shown for China are likely an under-estimate since many of the projects run by the state-owned companies are never reported in such a way that they reach the international mining press. With comparable reporting from China there is no doubt that the country would be ranked among the top 10.
|
About This Survey This review of metal mining projects is based on Raw Materials Projects, the database researched and published by Raw Materials Group, Stockholm, Sweden (www.rmg.se). The full database is available from RMG on an annual subscription basis and includes more than 3,200 projects as of December 2009, ranging from those in the prefeasibility stage to those currently under construction. Of the total number of projects listed in the database, more than 1,200 include detailed descriptions of resources/reserves, grades, planned investment cost and completion date. This survey includes all countries with known projects. In the process chain from ore to metal, its main focus is on the mining stage. Pure smelter projects are not listed. In some cases, however, where the process is fully integrated from mining to refining, such as acid pressure leach hydrometallurgical nickel projects, all stages are included. Eligibility for a full listing requires each project to have an announced investment cost estimate, reserve/resource data and an estimated annual production figure. Comparability of information from different companies, countries and regions varies, as specific project information or definition may be unclear for various reasons, or the project may also involve large unreported infrastructure costs. Raw Materials Group attempts to resolve these factors, but cannot rectify all discrepancies arising from definitions and comparability. Information contained in the survey is global in scope. However, it should be noted that completely accurate coverage of some regions is difficult to attain due to lack of information or corporate reporting standards and requirements. In total, mine projects are included from more than 70 countries and the survey’s aggregate figures are considered to reflect overall investment trends in the mining industry reasonably accurately. For more information, visit www.rmg.se or call +46-8-7440065. |
